41 years of federal spending data show the homeowner décor advantage eroding to a record low.
For four decades, the economics of home décor rested on a simple assumption: people who own their homes invest in them, and people who rent do not. Landlords repaint in eggshell white, tenants hang nothing heavier than a calendar, and the furnishings industry builds its entire go-to-market strategy around the closing date of a mortgage.
New analysis of 41 years of federal spending data suggests that assumption is quietly collapsing.
Printseekers Research analyzed the U.S. Bureau of Labor Statistics' Consumer Expenditure Survey, which records what American households spend, broken down by housing tenure, from 1984 through 2024.
The headline finding: renter households have increased their annual spending on household furnishings and equipment by 90.5% since 2003, compared with just 54.0% for homeowners with a mortgage.
In 2021, the homeowner-to-renter spending gap narrowed to exactly 2.00 to 1 — the smallest ratio in the 41-year history of the dataset.
The people with the least legal claim to their walls have become the fastest-growing spenders on furnishing their homes.
Key Findings
Renter spending increased 90.5%.
Annual furnishings spending among renters rose from $723 in 2003 to $1,377 in 2024. Homeowners with a mortgage increased their spending by 54.0% over the same period.
The homeowner-renter gap reached a record low.
Homeowners outspent renters 2.78-to-1 in 2005. By 2021, that ratio had fallen to 2.00, its lowest point in the 41-year dataset. It stood at 2.16 in 2024.
Renters led the pandemic nesting boom.
Between 2019 and 2021, renters increased furnishings spending by 39.7%, compared with 29.0% for homeowners with mortgages and 16.3% for mortgage-free owners.
Growth remained strong after adjusting for inflation.
Using the Bureau of Economic Analysis' furnishings price index, renter spending increased 81.0% in real terms between 2003 and 2024.
Renters are closing the spending gap with the average household.
Renter furnishings spending increased from 48.3% of the all-household average in 2003 to 57.0% in 2024.
The 90% Surge
The Consumer Expenditure Survey's "household furnishings and equipment" category covers the physical layer of domestic life: furniture, textiles, floor coverings, appliances, decorative items, and wall décor.
It is a continuous federal measure of how much Americans invest in furnishing their homes.
Split by housing tenure, the data tells two different stories about two different growth eras.
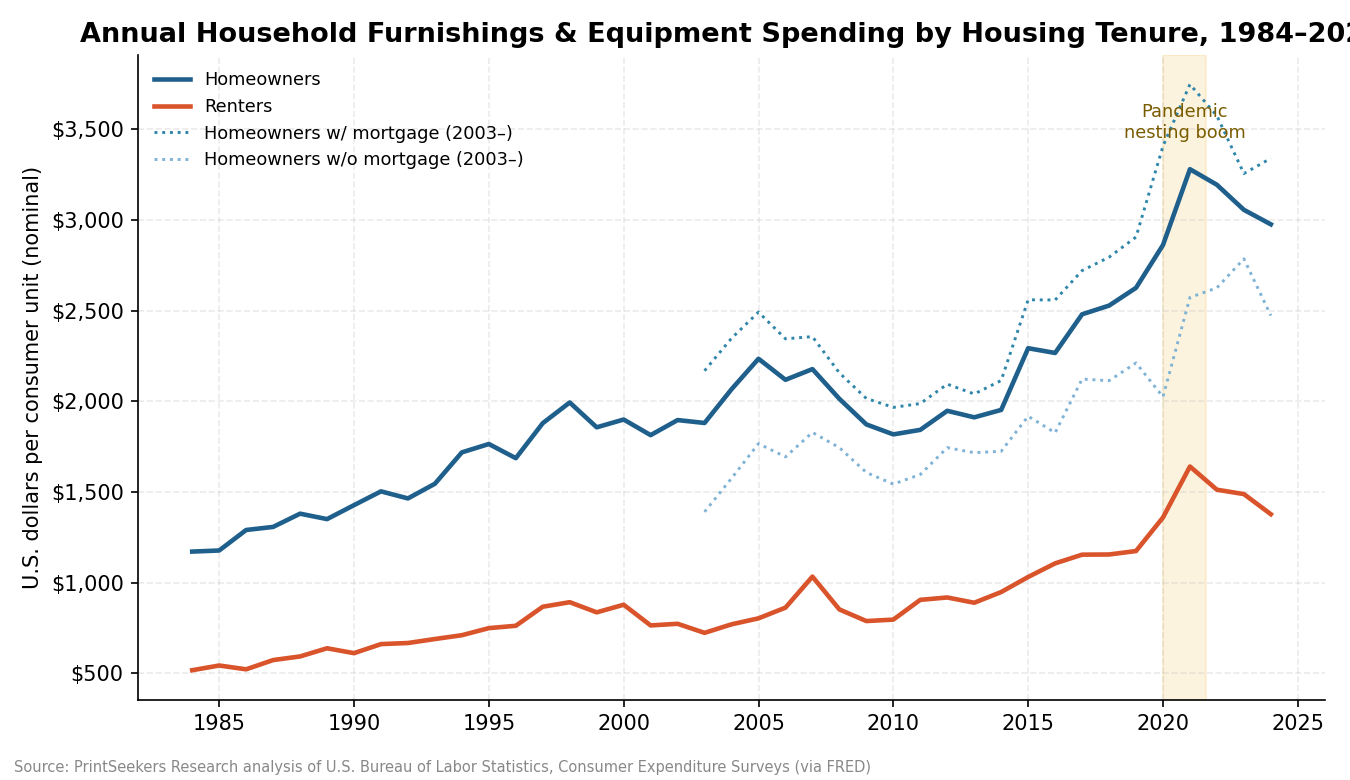
Fig. 1 — Annual furnishings and equipment spending per consumer unit by tenure, 1984–2024 (nominal). The shaded band marks the pandemic nesting boom.
From 1984 to 2003, renters behaved exactly as the industry expected.
Their spending crawled from $517 to $723 — a compound annual growth rate of just 1.78%, trailing homeowners' 2.52%.
The gap widened over time, peaking at 2.78× in 2005. For every dollar a renter spent furnishing their home, an owner spent almost three.
Then the lines bent.
From 2003 to 2024, renter spending growth accelerated to a 3.12% compound annual rate while homeowner growth decelerated to 2.21%.
Renters became the fastest-growing tenure segment in the furnishings economy — faster than mortgaged owners (+54.0%), outright owners (+77.8%), and the all-household average (+61.3%).
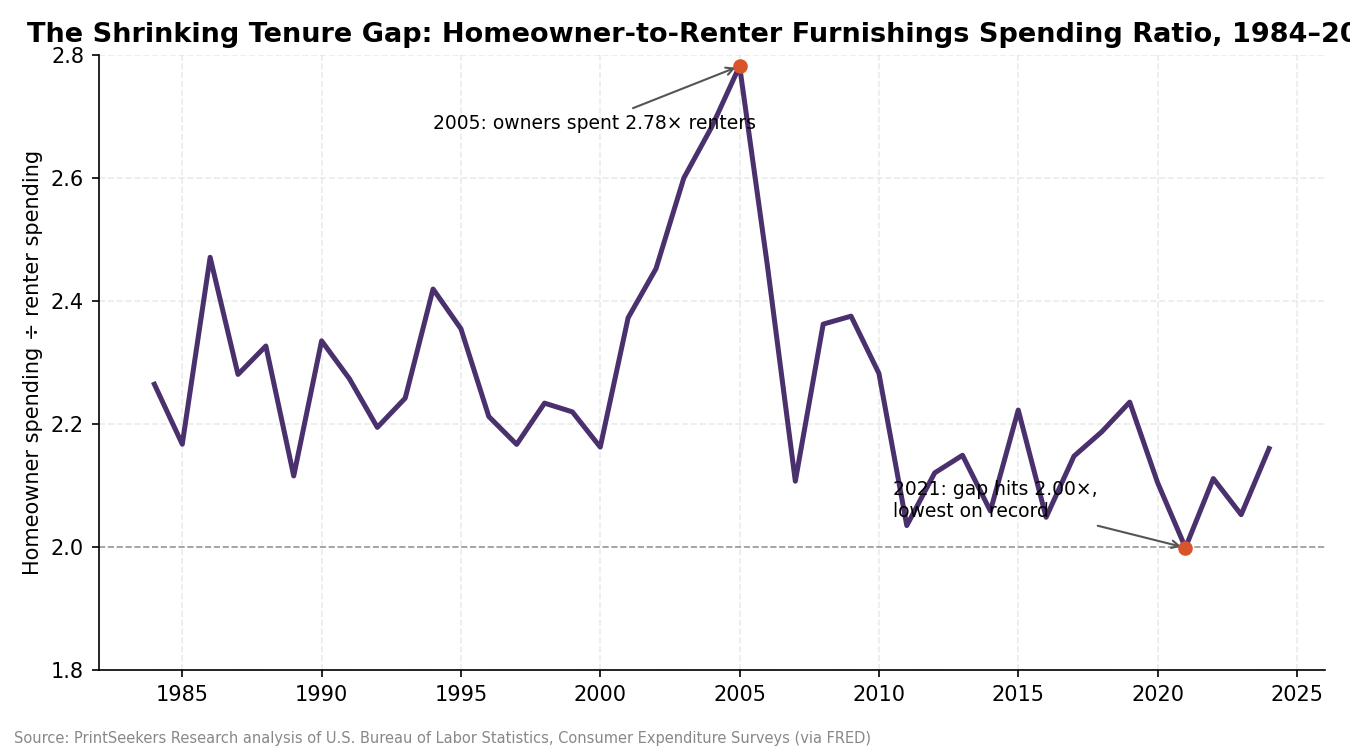
Fig. 2 — Growth indexed to 2003 = 100. Renters (+90%) outpace every owner segment, while furnishings prices (dashed) barely move.
By 2024, the average American renter household was allocating $1,377 a year — roughly $115 a month — to furnishing spaces they do not own and may leave within twelve months.
The Shrinking Gap
The single most striking series in the dataset is the ratio of homeowner to renter spending. It functions as a barometer of a cultural belief: that decorating is something you earn with a deed.
In 1984, the ratio stood at 2.26. It climbed through the 1990s housing expansion and peaked at 2.78 in 2005.
The 2008 financial crisis broke the pattern, as homeownership rates fell and more would-be buyers became long-term tenants, the spending ratio began a long-term decline.
It stood at 2.60 in 2003, 2.28 by 2010, 2.24 by 2019, and finally reached 2.00 in 2021 — parity's doorstep.
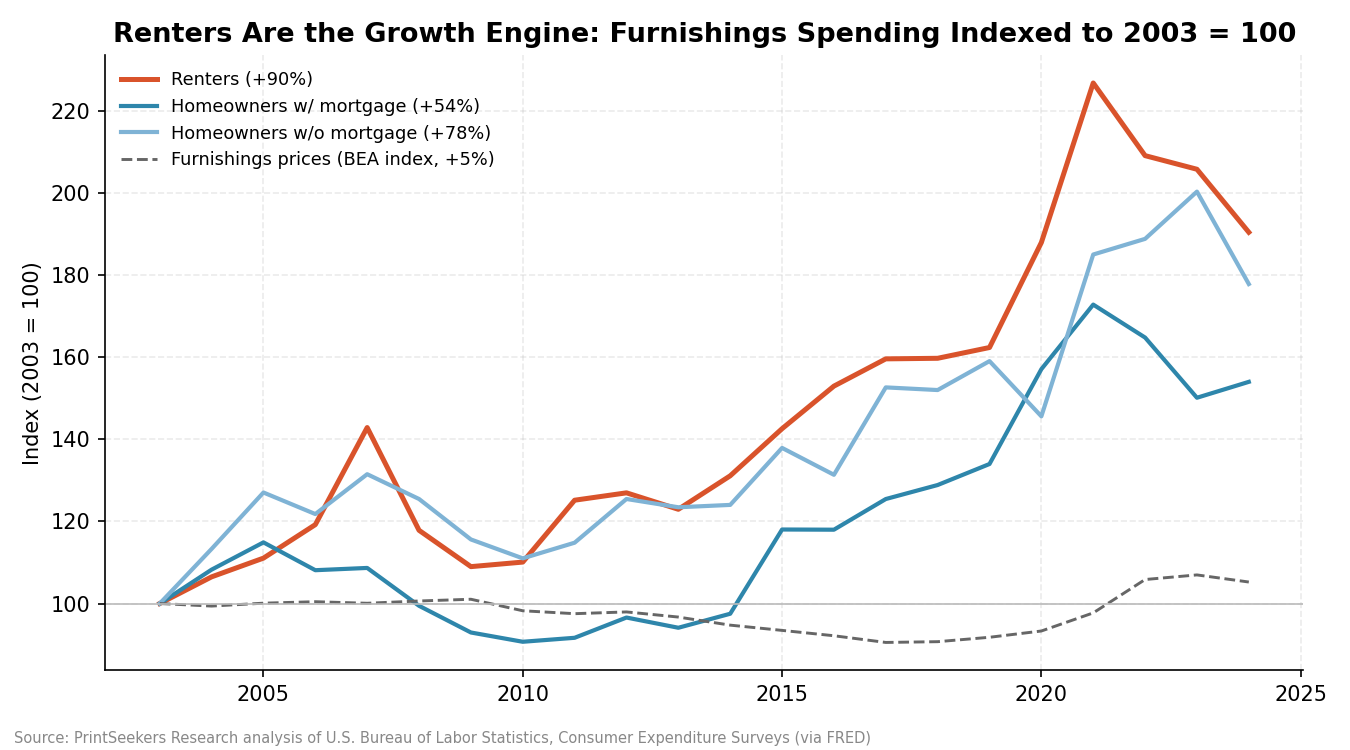
Fig. 3 — The homeowner-to-renter furnishings spending ratio peaked at 2.78× in 2005 before reaching 2.00× in 2021, the lowest level recorded.
Even after the post-pandemic normalization, the 2024 reading of 2.16 remains lower than in any year between 1986 and 2020.
The dollar figures make the same point differently.
The absolute gap between owner and renter spending was $1,157 in 2003 and $1,598 in 2024 — an increase of just 38% in nominal terms across 21 years, a period in which overall consumer prices rose considerably faster.
In relative terms, the "ownership premium" on domestic investment is eroding.
The Pandemic Inflection
If the 2008 financial crisis started the convergence, COVID-19 accelerated it. Between 2019 and 2021, all-household furnishings spending surged 28.7%, from $2,098 to $2,701, as lockdowns turned every dwelling into an office, gym, classroom, and restaurant.
But the surge was not evenly distributed.
Renters increased spending by 39.7%, the largest two-year jump for any tenure group in the dataset's history.
Mortgaged homeowners increased spending by 29.0%, while owners without a mortgage — disproportionately older, established households — increased spending by just 16.3%.
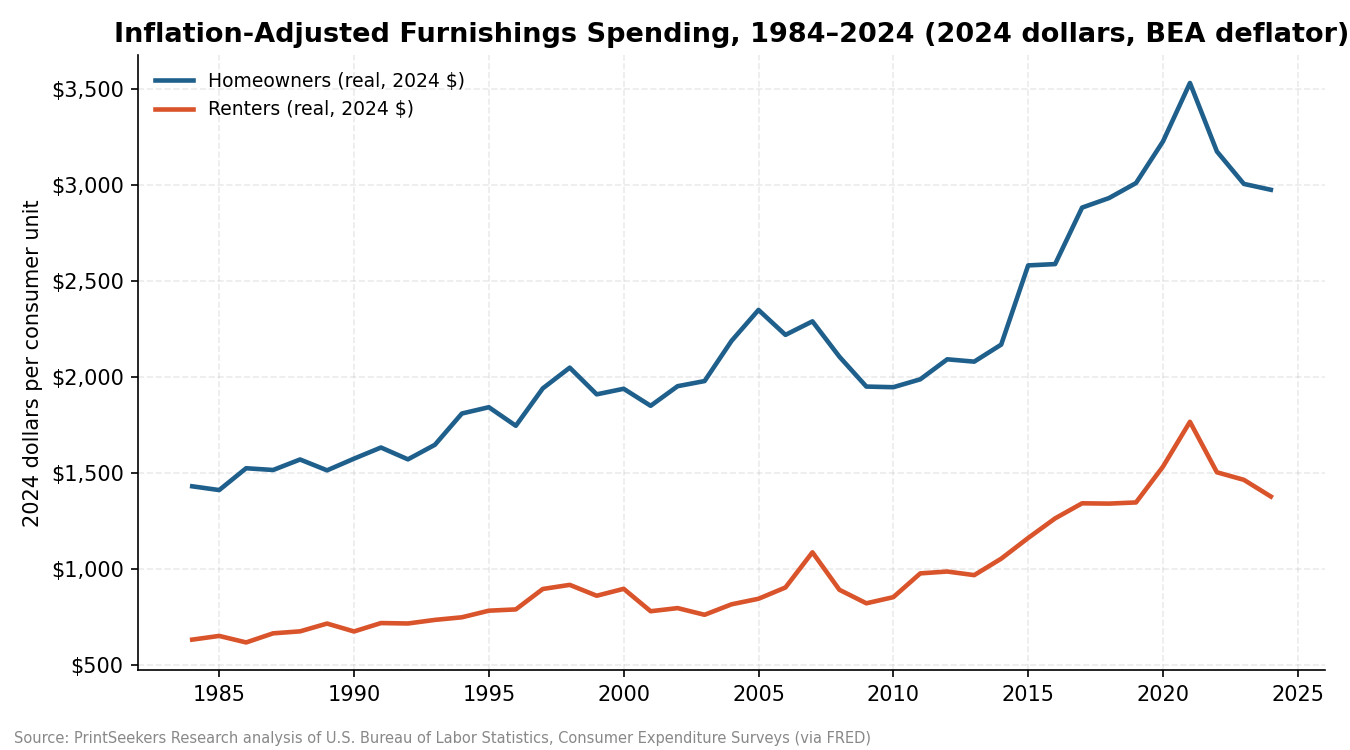
Fig. 4 — Renters posted the largest proportional spending increase during the pandemic. Spending has since cooled but remains above 2019 levels across all housing groups.
Read that against conventional wisdom - the pandemic home-improvement boom is usually narrated as a homeowner story of decks, kitchen remodels, and backyard renovations.
The federal spending data shows that the biggest proportional shift happened among renters. Confined to apartments that suddenly doubled as workplaces, renters appeared to place greater value on the spaces surrounding them.
Spending has since cooled from the 2021 peak across every group — renters to $1,377 in 2024 and mortgaged homeowners to $3,339.
But the reset point remains higher - renter spending in 2024 was still 17.3% above its 2019 level, while homeowner spending remained 13.3% above.
The pandemic didn't create the renter revolution, but it accelerated it.
The Price Paradox: Spending More While Things Got Cheaper
The most counterintuitive finding emerges when spending data is compared with the Bureau of Economic Analysis' chain-type price index for furnishings and household equipment.
Furnishings are one of the few consumer categories that experienced sustained deflation during the 21st century.
The index fell 10.6% between 2000 and its 2017 low, alongside globalized manufacturing, e-commerce competition, and advances in production technology. Even after the 2021–2023 inflation wave, furnishings prices in 2024 stood only 5.2% above their 2003 level.
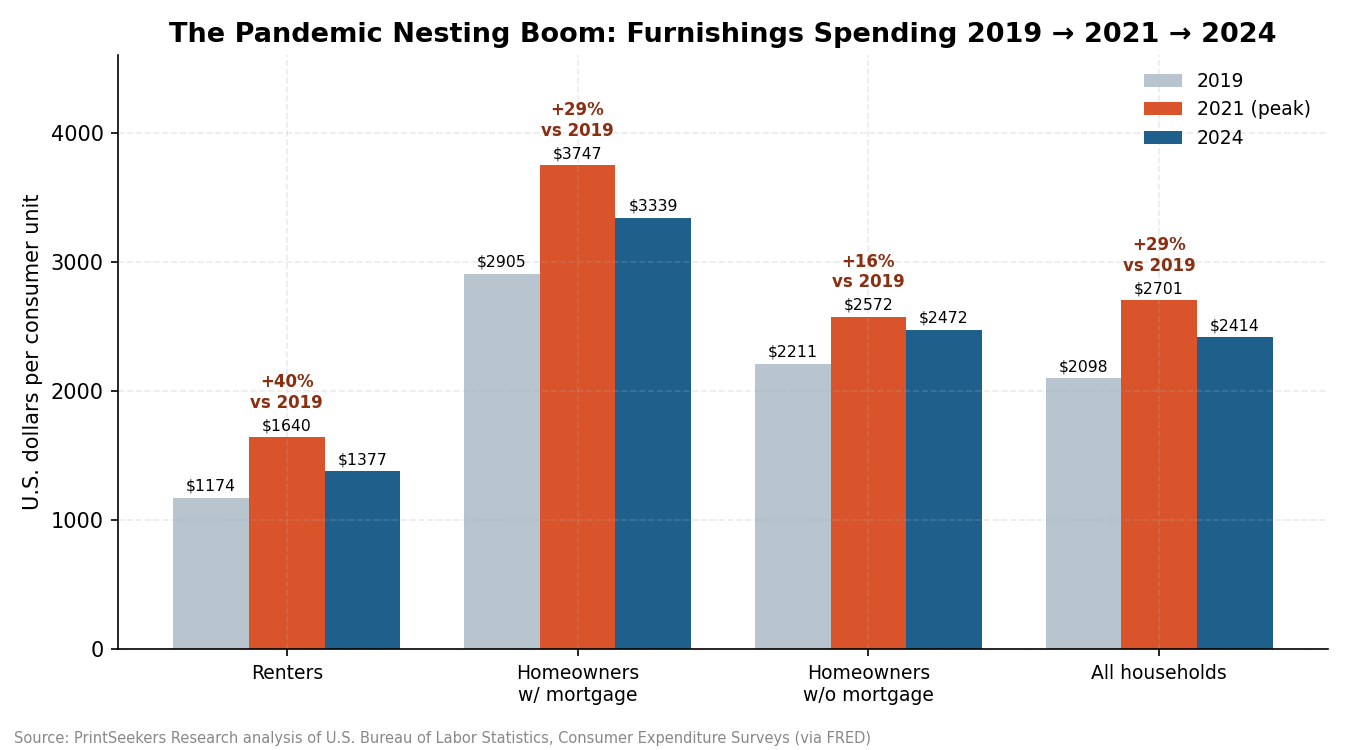
Fig. 5 — Real spending in 2024 dollars, adjusted using the BEA furnishings price index. Renters' inflation-adjusted spending more than doubled over the full 41-year period.
That changes the interpretation of the renter surge entirely. If prices were roughly flat while nominal spending nearly doubled, renters weren't simply paying more for the same basket of goods.
They were purchasing more in inflation-adjusted terms.
In 2024 dollars, real renter spending rose from $761 in 2003 to $1,377 in 2024 — an 81.0% real increase. Across the entire 41-year dataset, real renter spending more than doubled from $631 in 1984, measured in 2024 dollars.
Falling prices combined with rising real spending are consistent with a category becoming more accessible through technological innovation. Print-on-demand manufacturing reflects this wider shift in the wall art market. Advances in digital printing allow artists, businesses, and consumers to access customized wall décor without the inventory requirements and upfront costs associated with traditional large-scale production.
Why the Walls Changed Hands
The Consumer Expenditure Survey records what households spend, not why.
However, three structural shifts offer possible explanations for the changing relationship between renters, homeowners, and furnishings spending.
Renting Stopped Being a Phase
The U.S. homeownership rate fell from its 2004 peak near 69% to the low 60s following the financial crisis. Meanwhile, the median age of first-time homebuyers has climbed into the late 30s, according to the National Association of Realtors.
For many Millennials and Gen Z households, renting now extends through years traditionally associated with buying a first home. Marriages, career changes, growing families, and other major life events increasingly happen in rented properties.
Life events that once triggered a mortgage may now trigger a lease renewal, and the furnishings spending associated with those milestones may have moved with them.
Decorating Became Commitment-Free
The traditional barrier to tenant decorating was never necessarily a lack of interest. It was the cost, permanence, and potential consequences of making changes to a property someone else owned.
The 2010s brought an expanding range of products designed around temporary living spaces.
Removable hanging strips, peel-and-stick wallpaper, lightweight canvas prints, and framed posters made it easier to personalize a rental without major renovation.
Print-on-demand technology supports this shift.
A canvas print or framed poster can be manufactured individually, shipped directly to the customer, and taken to the next apartment when they move. As the cost and commitment required to personalize a space decrease, property ownership becomes less relevant to the decision to decorate.
The Home Became a Broadcast Surface
Remote work put domestic walls on camera, while social media increasingly turned interiors into expressions of personal identity. Whether someone owns or rents their apartment, their living space can serve as a backdrop for video calls, photographs, and online content.
A rented bedroom photographs identically to an owned one.
The 39.7% renter spending spike between 2019 and 2021 — nearly 11 percentage points above the increase among mortgaged homeowners — is consistent with households placing greater value on the spaces where they live, work, and appear online.
While the spending data cannot establish the motivations behind individual purchases, the timing aligns with these broader changes in how people use their homes.
Why It Matters
For the housing debate, the data complicates a familiar assumption: that renters are unwilling or unable to invest in their dwellings. The federal spending record shows renter households increasing their spending on furnishings and equipment at historically significant rates, even without the financial incentive of building home equity.
For retailers and manufacturers, the implications are strategic. An industry that segments its marketing primarily by homeownership status may be overlooking a rapidly developing customer group.
The 2.78× homeowner-to-renter spending ratio of 2005 no longer reflects the market.
By 2024, that ratio had narrowed to 2.16×, with renters recording faster long-term spending growth than homeowners.
For the print-on-demand industry, this represents a meaningful opportunity. Wall décor is portable, relatively affordable, and requires less commitment than traditional home improvement projects.
As first-time home purchases are delayed, consumers may furnish several successive rentals before purchasing a property.
On-demand manufacturing allows artists, retailers, and home décor businesses to respond to those changing needs without maintaining extensive inventories.
The American wall, it turns out, no longer belongs solely to the person on the deed.
It belongs to whoever is looking at it.
Methodology
Printseekers Research analyzed annual data from the U.S. Bureau of Labor Statistics Consumer Expenditure Surveys (CE), the federal program measuring household spending.
The data was retrieved through FRED, the Federal Reserve Bank of St. Louis, using the December 19, 2025 data vintage.
The primary measure is "Expenditures: Household Furnishings and Equipment" per consumer unit, categorized by housing tenure.
The analysis uses the following FRED data series:
- CXUHHFURNSHLB0101M — All consumer units, 1984–2024
- CXUHHFURNSHLB1705M — Renters, 1984–2024
- CXUHHFURNSHLB1702M — Homeowners (total), 1984–2024
- CXUHHFURNSHLB1703M — Homeowners with mortgage, 2003–2024
- CXUHHFURNSHLB1704M — Homeowners without mortgage, 2003–2024
- DFHHRG3A086NBEA — BEA furnishings chain-type price index (2017=100), used as the inflation deflator
Growth rates, housing-tenure spending ratios, compound annual growth rates, and spending-share calculations are original computations by Printseekers Research.
Inflation-adjusted figures use the BEA furnishings price index, rebased to 2024 dollars. Unless otherwise specified, spending figures are nominal.
Under BLS definitions, the renter category includes households paying rent or living rent-free in lieu of wages. The homeowner category includes owner-occupied houses, cooperatives, and condominiums.
Consumer Expenditure Survey figures represent survey-based averages per consumer unit and may be subject to revision.
The household furnishings and equipment category covers a broad range of products and does not isolate spending on wall art specifically.
Sources: U.S. Bureau of Labor Statistics Consumer Expenditure Surveys, U.S. Bureau of Economic Analysis, and FRED (Federal Reserve Bank of St. Louis).
Suggested citation: Printseekers Research, "The Renter Revolution" (2026), analysis of U.S. Bureau of Labor Statistics Consumer Expenditure Surveys via FRED, Federal Reserve Bank of St. Louis.
About Printseekers
Printseekers is a B2B print-on-demand production platform specializing in wall art, including canvas prints, framed prints, and posters, manufactured on demand for e-commerce brands, artists, and retailers worldwide.